“Vanity metrics are the numbers you want to publish on ‘TechCrunch’ to make your competitors feel bad.” – Eric Ries, Author – The Lean Startup
Team Hawk were coming up to the end of their release window at the end of the quarter. “125 story points,” Pat, their Scrum Master, proudly exclaimed. “We’re 20 points over last quarter,” Jessica, their Product Owner, replied. The team celebrated their increased velocity by planning a trip to the pub that evening. The efficiency gains were made through ruthless investment in automation over the past three months. However, not all was as it seemed. The team’s quarterly objective to increase bookings by 10% through the store’s shopping cart was not met. The features they released impacted this by just 2% over the quarter. Jessica’s excitement turned to gloom when the team reviewed the latest bookings numbers.
Two things happened here. The team was overly focused on an output metric (velocity). Eric Ries calls this a vanity metric; something which makes us feel good, but has little material impact on actual outcomes. They had also defined an outcome metric (increase bookings), but they had no way of tracking progress on the outcome metric over the quarter.
Pattern: Leading indicators
The challenge is that a metric such as bookings is generally a lagging indicator – we find out after the fact about the impact that has been made on this, sometimes a long time after the fact when it is too late to adjust. This lagging indicator is known as a business outcome. What we need in this case are leading indicators tying into this Business Outcome. These leading indicators are described by Teresa Torres (2021) as product outcomes.
Another key point about leading indicators is that they should be timeboxed to one to two weeks maximum. This would have helped Team Hawk from our example understand on a more continuous basis the impact of their incremental deliveries of work. Moreover, it synchronises nicely with their review cycles – for example, to review the latest leading indicators at their Sprint Review.
So, what would that look like in practice?
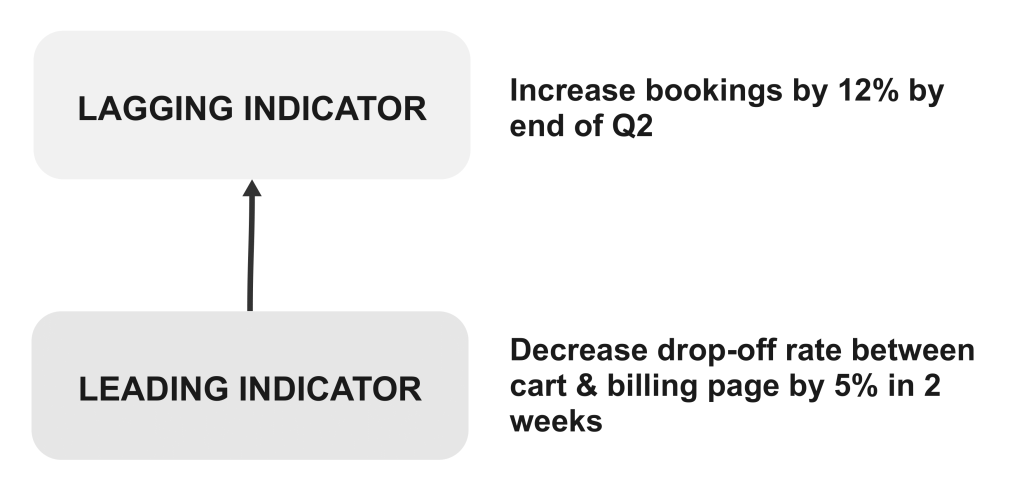
As we can see in the example (above) we still have our Increase Booking metric as a lagging indicator, but we have plugged a leading indicator of decreasing drop-off rate between the cart and the billing page. We know this will feed into our higher level goal from analysing past data of our checkout funnel.
Pattern: Actionable metrics
There are two types of metrics related to taking actions: the ones we can learn from, and the ones we cannot. From an effective metric we can take insights, discover behaviours, and take actions to improve our product. Therefore, these are actionable metrics. By contrast, we cannot learn or take actions from vanity metrics. Whilst our ego may improve, our product will not.
A mobile app can have millions of downloads but only a few thousands of active users, or a freemium product can see exploding traffic growth but barely few conversions to paying users.
| Vanity Metrics | Actionable Metrics |
|---|---|
| Hits on webpage | Bounce rates |
| Number of downloads | Paying users |
| Registered users | Conversion rate |
| Social media followers | Social media recommendation |
| Page views | App Store ratings |
| Net Promoter Score | Net Fitness Score |
| Marketing spend | Average order value |
| Raw growth numbers | A/B testing |
All Actionable Metrics should accomplish the three A’s:
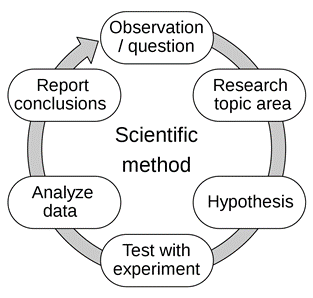
- Actionable: it must demonstrate a clear cause and effect, so everyone can learn from their actions, realising how to replicate the result in the report. The scientific method gives confidence that the observed behaviour was, in fact, caused by the change being tested.
- Accessible: it must be simple to read and interpret, and it must be easy to access the latest data (in a matter of minutes at most).
- Auditable: it must be accurate, enabling skeptics to audit a report translating the summary numbers in the report back to the actual users who generated them.