“A constellation of metrics / inputs and outputs discourage myopia” – John Cutler
Team Cupcake proudly shared an increasing trend in their metric around shopping cart completion rate with stakeholders at their sprint review. 12% more customers were progressing from the shopping cart to the billing page from the previous week. The team were confident that the new messaging they added to the cart page around a money-back guarantee was the reason why. All was going well, until Mitch – a Data Analyst in the room – brought up the fact that Team Muffin had shipped a discount code offer on the product details page the same week. The team fell silent – it was unclear which, if either, change was bringing about this impact.
Missing the bigger picture
What happened here was that the two teams were each contributing to the same higher level goal of increasing a conversion metric. Both improvements they made were totally valid and the metrics used by each were reasonable. The problem was they were being looked at in isolation, rather than connected together.
Whilst it is vital to have higher level product goals to inform which metrics to use, if we don’t have an interrelated collection of leading indicators to review collectively, we will fall into the trap of sub-optimisation. Instead, we need to see the bigger picture.
Pattern: Driver Trees
We talked earlier on the difference between leading and lagging indicators. The fact is all of these are signals, and have a different lead time to feedback for you, as a Product person. What’s important is to treat these more as a constellation of metrics, rather than each as a standalone. Each of these contributes to a higher level goal.
One analogy we like to use is the goal of getting healthy. This is a lofty aim, and there are many ways to contribute to this goal, but these need to be looked at collectively. For example, if I plan to walk more in order to get healthy, I might measure my step count. However, if I’m also going to the pub every night and eating junk food every day, then I probably won’t get healthy too soon!
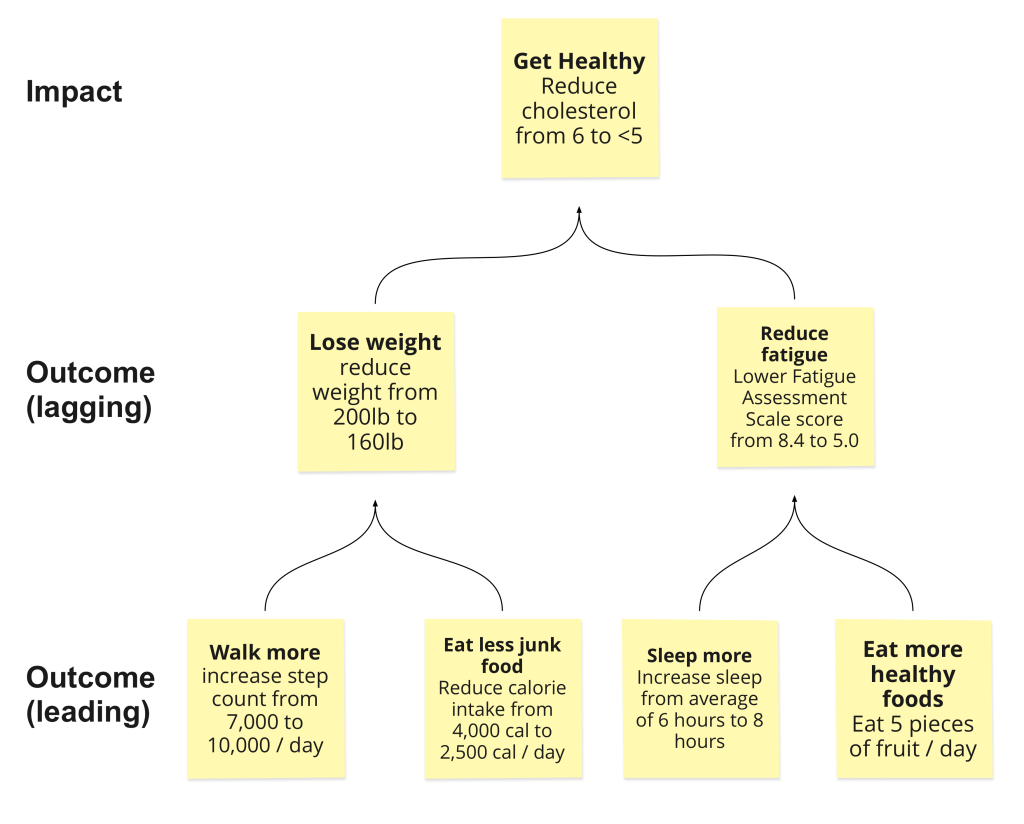
This is where the pattern of using Driver Trees (sometimes called KPI Trees) can help. A Driver Tree is a visualisation which connects your higher level Impact goal, to lagging outcomes (changes in human behaviour), to leading outcomes. As we can see in the above example, there is a connection between leading outcome indicators which we can review on a daily or weekly basis; lagging outcome indicators, which could be monthly or quarterly; and lagging impacts, which we might review annually. The arrows on a Driver Tree purposely are directed from leading towards lagging, because these changes in behaviour drive the impact we are trying to create. Using a Driver Tree, I can keep track of whether I’m on the road to fulfilling my New Year’s resolution of getting healthy!
Next, let’s look at a product example of using a Driver Tree.
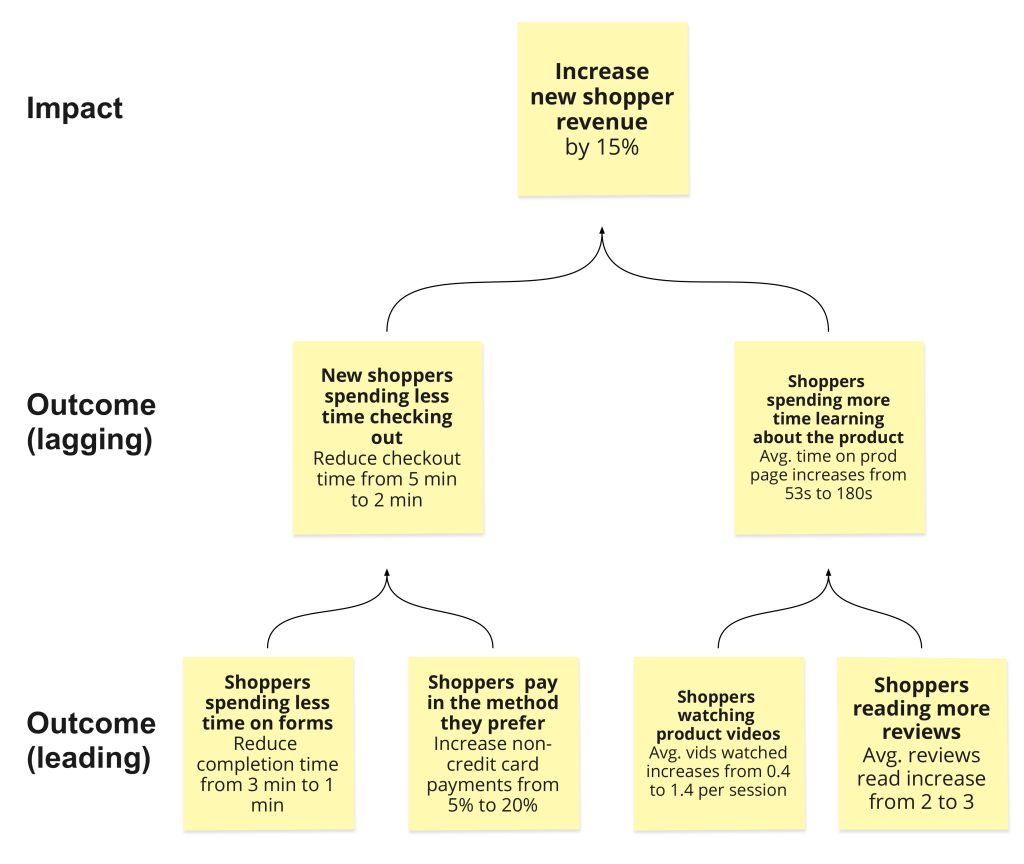
In this example, we want to increase new shopper revenue on our online retailer website. We’ve then reviewed which user behaviours contribute to that, and organised those behaviours into both lagging and leading indicators. Using arrows, we have made connections, to see which behavioural changes are inputs into higher level outcomes. Driver Trees like this one are a useful visualisation for teams to review on a periodic basis, to see which variables are contributing most to the impact they’re trying to create, and which ones may need further work.
We have found Driver Trees to be a powerful method for product teams to see the big picture of how their impacts and outcomes are connected and how they are performing on a regular basis, and eradicate lone-wolf metrics.
